How to Harness Project Timelines with a Burndown Chart
Last Updated March 8, 2024
In a perfect world, every Sprint in an Agile project would go exactly as planned, users would provide ample timelines and all facets of a project would stay on track. However, in the real world, scope changes and unforeseen issues arise, which can cause meeting and project timelines to be delayed.
To better understand real progress on a project and the remaining work to be done, Agile project managers can use a burndown chart, a business intelligence tool that helps inform better decision making. According to Villanova University’s Foundations of Agile Methodology course, unlike a metric without any context, (such as percentage complete) a burndown chart provides the total definition of time in a Sprint, which is more concrete.
What is a Burndown Chart?
A burndown chart visually charts remaining work against remaining time, enabling project managers and stakeholders to easily isolate potential issues that could impede project deadlines. Unlike more abstract ways of managing a timeline, a burndown chart maps the development team’s progress through user stories, including the total effort.
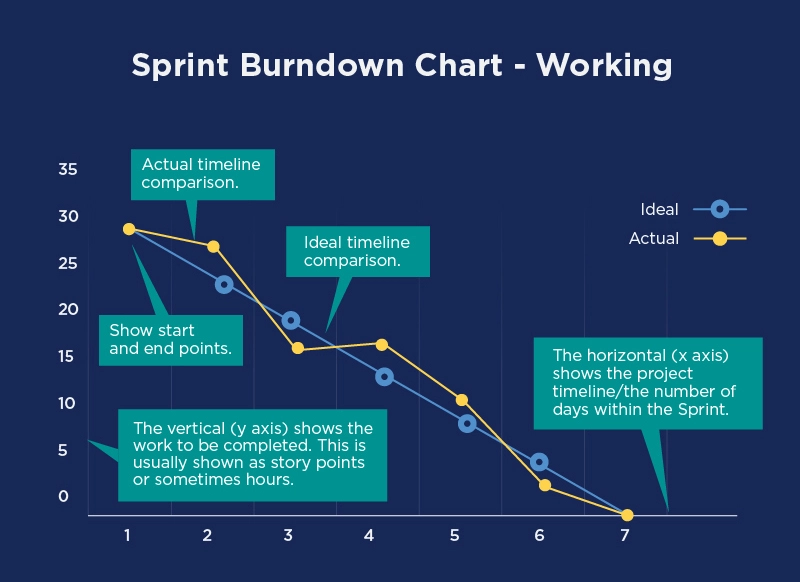
In addition, the chart often includes an ideal work remaining line based on forecasting to serve as a benchmark for teams, though it is rare for any project to run ideally from start to finish. Instead, project managers can analyze the variance from the ideal, forecast the likely actual variance at completion and make adjustments as necessary, according to A Guide to the Project Management Body of Knowledge (PMBOK® Guide), Seventh Edition.
The chart should be visible to everyone on the team and updated and reviewed daily.
How to Read a Burndown Chart
A burndown chart illustrates how closely project progress is mirroring the model. While the actual work line is likely to stray from the ideal, linear version, the two should meet at the end of the project.
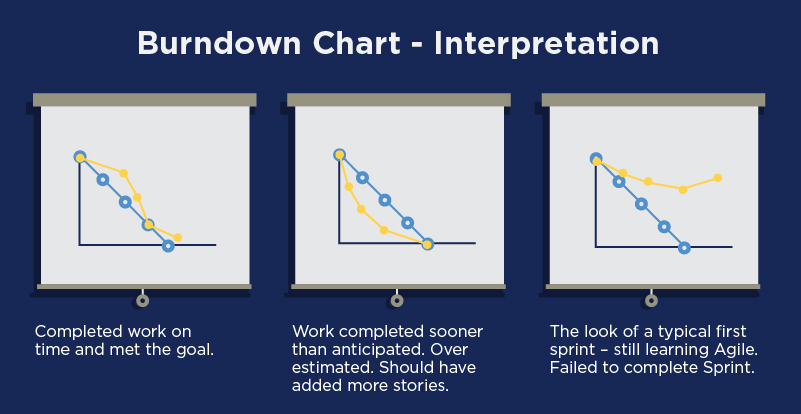
If work is completed earlier than expected (the actual line is predicted to complete before the timeline), it indicates there was opportunity to include additional stories. If the Sprint is projected to have work remaining when the time is up, it means the Sprint wasn’t completed efficiently. According to the Foundations of Agile Methodology course, failing to complete a Sprint is a common problem for new Agile teams who are learning how to work together and prioritize assignments. However, a burndown chart offers a great way to communicate visually to management how the process can improve for future Sprints.
As Sprints are mapped, the project team should assess the emerging story. If progress appears flat, the team should consider potential influences to better manage the next sprint. Questions to ask include:
- Was a project team member sick or on vacation?
- Did the team receive enough information to get this amount of work done?
- Did the team accept too much work from the Product Owner?
- Was there a technology issue?
- Was the Scrum Master unable to remove an obstacle?
- Did the stakeholder introduce too many superfluous items?
- Was the estimation of stories inaccurate?
Benefits of a Burndown Chart
A visual representation of a project’s critical timeline data is valuable for helping all stakeholders understand the status of the project. In addition, a burndown chart enables:
- Proactive problem solving, as teams can anticipate areas that may be time consuming or troublesome.
- A visual way to measure performance, identify process gaps and inform continuous improvement
- Ability to identify total effort, referred to in Agile as velocity. For example, teams can identify user stories that required excessive effort and reset expectations for similar requests at future stages.
Limits of a Burndown Chart
Users should also consider what a burndown chart is not able to show to help set expectations with team members and stakeholders. This includes:
- No changes are displayed if the scope of work changes, and the chart shows only the completed stories
- Perspective is limited to the overall trend of the project, not detailed information in the backlog
- The chart is estimate-driven, which means if teams over or underestimate required times, the accuracy of the chart may lessen
When Agile teams understand limitations, estimate thoughtfully and keep the burndown chart visible and engaged for everyone, they can better harness their timelines to stay on schedule and understand impediments along the way.