What is a Six Sigma Process Map?
Last Updated October 19, 2023
Six Sigma methodology focuses on increasing the quality of goods and services by improving the processes that produce them. While a process may produce tangible objects, the process itself is an abstraction – it is not palpable with the senses. The danger of working with concepts like this is that many find it difficult to understand or relate to something they can’t see, feel or hear.
Since a project team can’t improve what it doesn’t understand, Six Sigma requires a tool to make a concept – a process – real. This tool is known as a process map.
What Can You Do with a Process Map?
In many cases, team members approach a project with different mental pictures of a process. A process map helps the team approach improvements with a common understanding of the process. A detailed process map also provides other benefits.
- It displays problems such as needless complexity, redundancy and unnecessary loops. This is the first step in simplifying and standardizing the process.
- It enables a side-by-side comparison of the current process and the ideal process to help identify areas of improvement.
- It allows the team to study any steps that diminish performance.
- It identifies areas that need additional data investigation.
- It serves as a training tool to help the team understand the entire process.
Creating a Six Sigma Process Map
If your project team doesn’t already have a well-defined process map when beginning a project, it can create one. Working together as a team to create a process map tends to give the team a better understanding of the process. It can be completed in a six steps:
- Set the boundaries of the process – Define where the process begins and ends. Agree on the level of detail the chart should display.
- Identify steps in the process – List all major inputs, outputs and decisions from the beginning to the end of the process.
- Arrange the steps in sequence – Begin by diagramming the process as it currently exists.
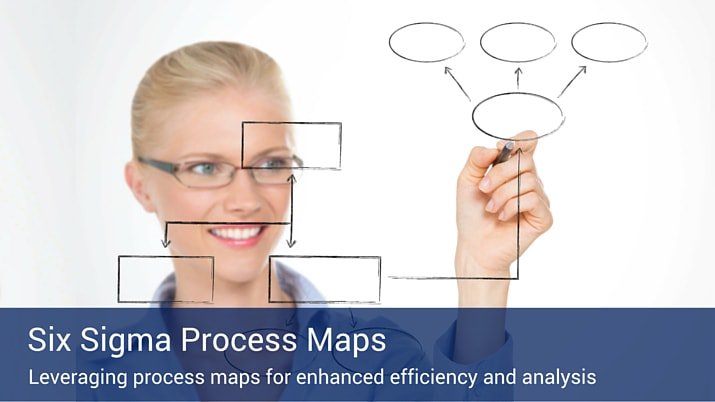
- Use the appropriate symbols – Each symbol in a process map has a specific meaning, make sure that you are using the symbols correctly:
- An oval is used to show the inputs (materials, information or action) and outputs (final product) at both ends of the process.
- A box or rectangle is used to show a task performed in the process.
- A diamond shows points in the process where a decision must be made.
- An arrow that connects symbols shows handling, transport or movement of material.
- Test the map for completeness – Have a “fresh pair of eyes” from outside the team review your process map to make sure that it is accurate and comprehensive.
- Analyze the process map – When the process map has been completed and validated, it gives you a concrete tool to answer important questions about the process.
- Is the process being run as it should be?
- Are there complexities that can be eliminated or simplified?
- How is the current process different from the ideal one?
A detailed and accurate process map is critical to improvement because it promotes a clear understanding of the process, which can lead to more ideas and better solutions.